#4 – 20133 102nd Avenue, Langley, B.C. V1M 4B4 Canada

#4 – 20133 102nd Avenue, Langley, B.C. V1M 4B4 Canada
Choosing a Vibration Measuring Device is not just a matter of comparing prices or screen sizes. The right instrument helps buyers detect imbalance, looseness, bearing wear, and other changes before they become costly surprises. Yet readings can mislead when sensor placement, machine speed, or mounting quality is overlooked.
Vibration analyst Robert B. Randall, author of Vibration-based Condition Monitoring, offers a valuable perspective through his work: measurements need context before they can support reliable diagnosis. That is a paraphrase of his approach, not a verbatim quotation. It is an important distinction. A sharp-looking graph alone proves little.
This guide compares ten devices for global buyers, with attention to measurable details: frequency range, sensor type, channel count, data storage, connectivity, and software workflow. We also consider practical use on a factory floor, where gloves, noise, limited access, and rushed inspections are real constraints. Calibration support and clear documentation matter, especially when equipment moves between sites or teams.
No device fits every plant. Some buyers need a compact handheld meter for routine checks; others need multi-channel analyzers for deeper diagnostics. Budget matters, but so do training and ongoing support. A low-cost instrument may be enough. Or not.
The rankings aim to clarify trade-offs, not promise a universal winner. Compare specifications with your assets, operating conditions, and maintenance skills. Then verify the details with manufacturers before purchase.
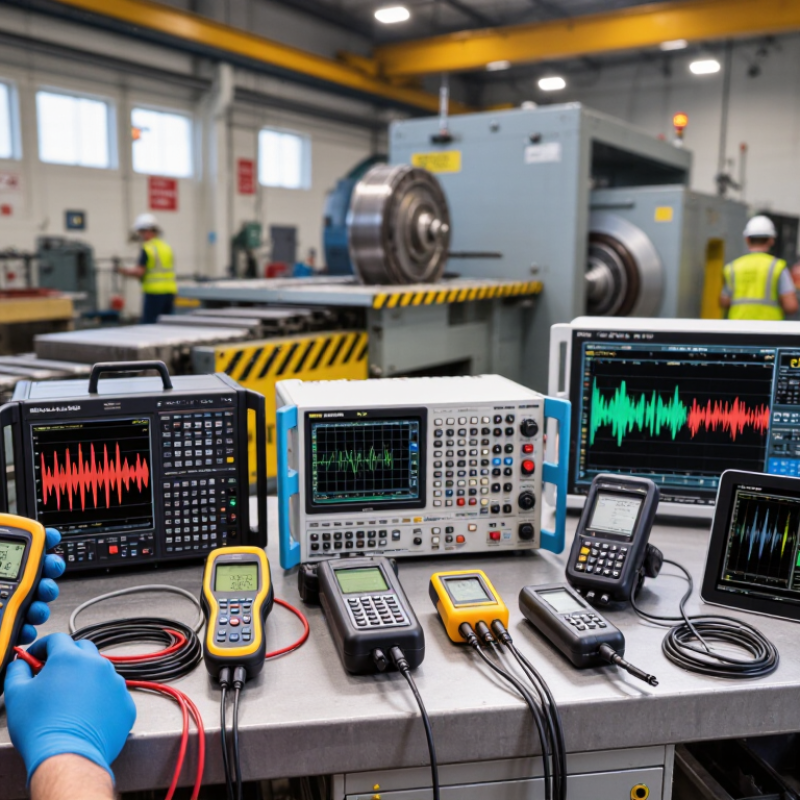
Vibration is not one number. Displacement measures how far a machine surface moves, usually in micrometres or mils. Velocity measures how quickly that movement occurs, commonly in millimetres per second RMS. Acceleration captures how quickly velocity changes, expressed in metres per second squared or g. Units matter. For a steady sinusoidal vibration, velocity and acceleration rise with frequency even when displacement stays constant. A small, high-frequency bearing fault can therefore produce a strong acceleration reading while displacement remains tiny.
Choose the measurement to match the fault and machine. Velocity is widely used to assess overall vibration on rotating equipment; ISO 20816-1:2016 outlines general procedures for measuring and evaluating machine vibration. Acceleration is useful for detecting higher-frequency impacts, while displacement can reveal slower shaft motion. Frequency range, sensor mounting, and measurement location all affect results. A handheld reading on a painted cover may not match a properly mounted sensor near a bearing. Field readings are rarely perfect; that detail is easy to overlook.
The U.S. Department of Energy’s Operations & Maintenance Best Practices guide reports that predictive maintenance programs can reduce downtime by 35–45%. This is a program-level estimate, not a guaranteed result from buying one instrument. Compare readings taken at consistent locations and operating conditions, then record the units and frequency range. Otherwise, the numbers may look precise but tell an incomplete story.
This comparison covers common instrument and sensor types used to measure vibration. Capabilities and usable frequency ranges depend on the specific model, sensor, mounting method, and measurement setup.
| No. | Device Type | Primary Measurement | Common Units | Typical Frequency Suitability | Common Applications | Buyer Considerations |
|---|---|---|---|---|---|---|
| 1 | Handheld vibration meter | Overall vibration level; some models also display acceleration and displacement | Velocity: mm/s RMS or in/s RMS; acceleration: m/s² or g; displacement: µm or mil | Generally intended for routine machine-condition checks; verify the instrument’s stated bandwidth | Quick checks on motors, pumps, fans, and other rotating machinery | Check which quantities and detector settings are supported, along with sensor compatibility and calibration requirements. |
| 2 | Portable vibration analyzer | Vibration spectrum and time waveform, usually with acceleration measurement | Acceleration: m/s² or g; velocity: mm/s or in/s; frequency: Hz or CPM | Model- and sensor-dependent; commonly used to examine machine vibration components across a selected bandwidth | Fault diagnosis, bearing and gear analysis, balancing, and troubleshooting | Review frequency range, number of channels, FFT resolution, recording options, and available analysis functions. |
| 3 | Route-based vibration data collector | Repeated readings at predefined machine measurement points | Typically acceleration, velocity, or displacement in their respective units | Depends on the connected sensor and the configured measurement settings | Scheduled condition-monitoring rounds across multiple machines | Consider route management, repeatable sensor positioning, data export, and compatibility with existing monitoring workflows. |
| 4 | Online vibration monitoring system | Continuous or scheduled vibration signals, alarm values, and trends | Acceleration: m/s² or g; velocity: mm/s or in/s; displacement: µm or mil | Determined by the sensors, acquisition hardware, sampling settings, and system configuration | Critical rotating equipment and installations requiring remote or continuous monitoring | Check channel count, alarm configuration, data storage, connectivity, environmental rating, and system integration. |
| 5 | IEPE piezoelectric accelerometer | Acceleration | m/s² or g; output is commonly specified in mV/g | Often suited to dynamic vibration measurements; the usable range varies with sensor design and mounting | Machine vibration, structural testing, and laboratory measurements | Requires compatible IEPE constant-current power. Check sensitivity, frequency response, mounting, temperature limits, and cable requirements. |
| 6 | MEMS accelerometer | Acceleration, often including static acceleration or tilt | m/s² or g | Ranges from low-frequency or DC-capable measurement to higher-frequency use, depending on the sensor | Embedded monitoring, portable instruments, low-frequency motion, and applications with space constraints | Compare noise density, bandwidth, measurement range, axis count, power needs, and sensitivity to temperature. |
| 7 | Seismic velocity transducer | Vibration velocity | mm/s or in/s; output may be specified in mV per unit of velocity | Typically selected for a defined frequency band; the sensor’s response limits should be checked | Machine vibration monitoring where a velocity-proportional sensor is appropriate | Confirm frequency response, orientation, mounting, output type, and whether the monitoring input matches the sensor. |
| 8 | Eddy-current proximity probe system | Relative shaft displacement and shaft position | µm or mil; output is commonly specified as voltage per displacement | Suitable for shaft-motion measurements within the probe and driver system’s specified bandwidth | Relative vibration and position measurement on accessible rotating shafts | Requires a compatible probe driver and a suitable conductive target. Check probe gap, target material, calibration, and installation geometry. |
| 9 | Laser Doppler vibrometer | Surface vibration velocity without physical contact | m/s, mm/s, or other velocity units; some systems also provide derived displacement or acceleration | Can cover a broad range, but the actual bandwidth depends on the optical system and measurement configuration | Non-contact testing of structures, small components, and difficult-to-access or delicate surfaces | Consider surface reflectivity, line of sight, stand-off distance, optical setup, and whether a reflective treatment is needed. |
| 10 | Geophone | Ground or structure motion, commonly velocity-proportional over its designed response band | Velocity: m/s or mm/s; output may be specified in V per unit of velocity | Selected for a particular low-frequency response; the natural frequency and usable band are model-dependent | Seismic surveys, ground-motion monitoring, and vibration measurements in civil or geotechnical work | Check natural frequency, damping, orientation, ground coupling, and the acquisition system’s input requirements. |
Unit note: 1 g = 9.80665 m/s². RMS and peak values are different reporting conventions and should not be compared without accounting for the signal type and processing method. For a pure sinusoid only, peak acceleration, velocity, and displacement are related through frequency.
| Quantity | SI Unit | Other Common Units | What It Describes |
|---|---|---|---|
| Acceleration | m/s² | g | Rate of change of velocity; often useful for higher-frequency vibration and impact measurements. |
| Velocity | m/s | mm/s, in/s | Rate of change of displacement; commonly reported for machine vibration severity. |
| Displacement | m | µm, mm, mil | Distance moved from a reference position; often important for shaft motion and lower-frequency vibration. |
| Frequency | Hz | CPM (cycles per minute) | Number of vibration cycles per second or minute; 1 Hz = 60 CPM. |
ISO 20816 is not one universal pass/fail chart. ISO 20816-1:2016 sets general principles, while relevant parts address specific machine types. Evaluation depends on vibration magnitude and change over time, plus machine class, support stiffness, and operating state. A reading from a rigidly mounted pump cannot be judged fairly against a flexible installation using one shared limit. Context matters.
For buyers comparing vibration measuring devices, check that the instrument captures the quantities and frequency range required for the equipment. Common measurements include RMS vibration velocity, acceleration, and displacement. Record sensor position and direction, shaft speed, and load; a sensor placed on a bearing housing can tell a different story from one mounted on a thin cover. Steady-state readings should not be casually compared with startup data. That detail is easy to miss.
The U.S. Department of Energy’s Operations & Maintenance Best Practices guide (2010) reports predictive-maintenance programs can reduce maintenance costs by 25–30% and downtime by 35–45% versus reactive maintenance. These are program-level estimates, not guaranteed savings from buying a meter. A practical shortlist should include repeatable measurements, clear trend storage, and suitable mounting options. Still, no device can fix poor measurement habits. ISO limits also need careful interpretation when speed or load changes.
When comparing vibration measuring devices, treat the sampling rate as a measurement limit, not a marketing number. Nyquist requires at least two samples per cycle of the highest frequency you need to capture. A 2 kHz vibration therefore needs a theoretical minimum of 4,000 samples per second. That is only the floor. Real sensors and data-acquisition units need room for anti-aliasing filters to work, so a higher rate is usually safer. Otherwise, high-frequency motion can appear as a false lower-frequency signal. That matters.
It is tempting to stop at twice the target frequency, but that leaves little margin. Before buying, check the sensor’s usable frequency range, the sampling rate per channel, and whether channels are sampled simultaneously. A fast logger cannot recover vibration the sensor fails to detect. For a 1 kHz upper frequency, the basic Nyquist minimum is 2,000 samples per second; in practice, users often select several times that rate and verify the filter specifications. Longer records improve frequency resolution, while higher rates create larger files. Storage can become the quiet constraint. Compare a known test tone with the displayed spectrum, and watch whether peaks shift when settings change. Some devices list maximum rates that drop when multiple channels run together, so check the details.
The Nyquist criterion requires a sampling rate of at least twice the highest frequency in the signal. The values shown are theoretical minimums: for example, measuring vibration up to 250 Hz requires at least 500 samples per second. In practice, higher rates are commonly used to support anti-alias filtering and better waveform capture.
A useful comparison of ten vibration measuring devices starts with the sensor, not the price. Piezoelectric accelerometers suit machine casings and capture rapid changes, such as a bearing fault. MEMS accelerometers are lighter and often work well for low-frequency movement or portable checks. Velocity pickups are common on rotating equipment when vibration speed is the key reading. Eddy-current probes measure shaft displacement without touching it, while capacitive sensors suit small-gap measurements on precision equipment.
Laser Doppler vibrometers measure surface motion without contact, which helps when mounting a sensor could affect a light structure. Triaxial accelerometers record movement across three axes, useful when direction is uncertain. Handheld vibration meters support quick screening, but usually provide less diagnostic detail than FFT analyzers, which separate vibration into frequency components. Wireless monitoring nodes are practical for equipment that is difficult to reach often. Each has trade-offs.
For a pump, a casing-mounted accelerometer may be enough; a turbine shaft may call for a displacement probe. Check frequency range, mounting method, environmental protection, and calibration needs before comparing readings. A high sample rate is not automatically better if the application is poorly defined. The ranking is not perfectly clean: some devices overlap, and setup can change results. Small details matter. A loose mount can make a sound sensor misleading.
Top 10 Vibration Measuring Devices for Global Buyers
When comparing vibration meters, analyzers, and data loggers, look beyond range and price. Ask for calibration records linked to the device’s serial number. A certificate should identify the method, date, results, and measurement uncertainty. Traceability matters. Check whether calibration was performed by a competent laboratory with documented links to recognized measurement standards. Calibration intervals depend on use, environment, and quality procedures; one interval does not fit every buyer.
Tips: Check the certificate. Match its serial number to the device, and confirm the tested frequency range covers your work. Small details matter.
Standards and data compatibility can make a capable instrument difficult to use. Confirm that measurement settings align with the relevant test method for your application. Check units, sampling rate, timestamps, and export formats such as CSV. If data must enter existing analysis software, request a sample file before purchase. Not always straightforward. Teams sometimes discover that useful readings arrive without sensor orientation or setup notes. That is easy to overlook, and worth discussing with the supplier before comparing the final shortlist.