#4 – 20133 102nd Avenue, Langley, B.C. V1M 4B4 Canada

#4 – 20133 102nd Avenue, Langley, B.C. V1M 4B4 Canada
Injection molding design transforms a digital concept into repeatable plastic parts. It connects product function, material behavior, tooling, and factory performance. A well-planned design can produce thousands of consistent components with controlled dimensions and clean surfaces. However, success rarely comes from appearance alone. Wall thickness, draft angles, ribs, bosses, and gate locations can determine whether a part fills correctly or warps after cooling.
The process begins when heated polymer enters a machined mold under pressure. The material flows through runners and gates, fills the cavity, and cools against the mold walls. Ejector pins then release the finished part. Experienced designers study flow paths, cooling conditions, shrinkage, and likely stress points before production begins. They may use simulation software, prototype trials, and measured samples to verify their decisions. Even a small feature, such as a 0.5-millimeter corner change, can affect filling, strength, or tool life.
No design is flawless initially. That matters. A sharp internal corner may look efficient, yet it can concentrate stress and complicate machining. A very thin wall may reduce material use but create uneven filling. This guide explains how injection molding design works from concept development through mold testing and refinement. It also considers material selection, manufacturability, quality control, and production cost. Practical judgment remains essential, because software predicts behavior, while real molds reveal unexpected variation. Good decisions come from combining engineering knowledge, production experience, reliable measurements, and a willingness to revise weak assumptions.
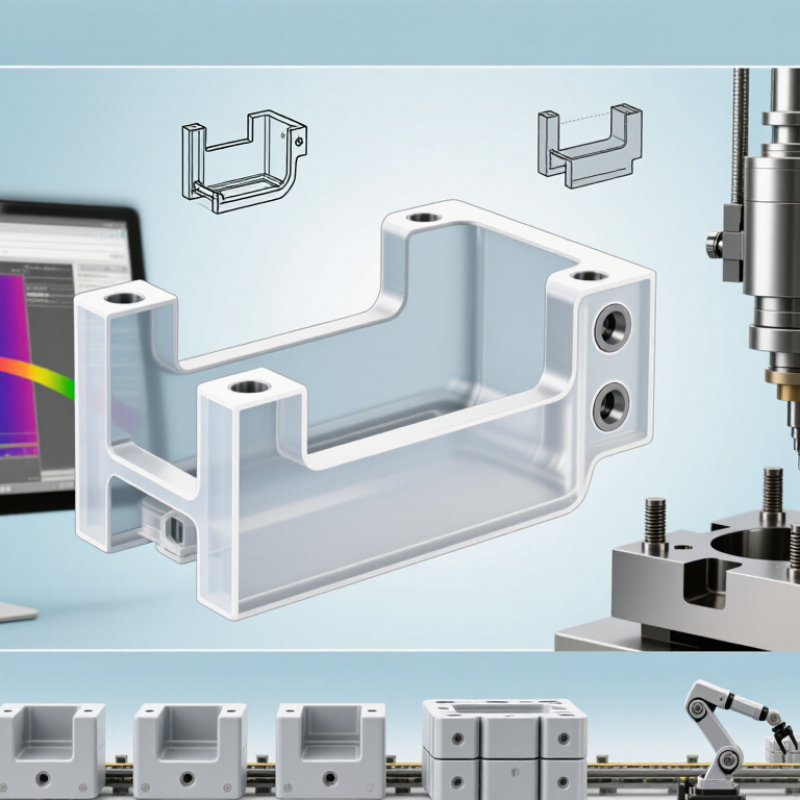
Injection molding design connects four decisions: the part, mold, machine, and material. Each decision affects cost, strength, cycle time, and production risk.
A part begins with practical geometry. Uniform walls reduce sink marks and uneven cooling. Draft angles help eject the part cleanly. Ribs add stiffness, while bosses support screws or inserts. Gate location matters because flow marks and weld lines can appear on visible surfaces. Designers also allow for material shrinkage. Small details matter.
The mold contains the cavity, core, parting line, cooling channels, and ejector system. Its steel or aluminum construction should match expected production volume. The machine must provide enough clamping force and shot capacity. Too little force can create flash. Too much capacity may waste energy and capital. Material selection adds another layer. ABS supports impact resistance, polypropylene offers flexibility, and engineering polymers tolerate higher heat, but each behaves differently during filling and cooling.
PlasticsEurope reported global plastics production of 400.3 million tonnes in 2022, showing the scale of material decisions. Grand View Research estimated the global injection-molded plastics market at approximately USD 387.4 billion in 2023, with continued growth through 2030. These figures describe a large industry, not guaranteed project success.
A drawing can look complete and still fail during ejection. In practice, mold-flow analysis, prototype trials, and measured cycle data expose weaknesses earlier. Even then, predictions are imperfect.
Real production often teaches the final lesson.
Injection molding design turns a digital part concept into a repeatable manufacturing process. Wall thickness and draft angle strongly influence filling, cooling, ejection, and surface quality. In practical design reviews, engineers often begin with walls between 1 and 4 mm. The exact value depends on material, part size, flow distance, and structural demands. Thin walls may fill poorly, while thick areas can cool unevenly.
Keep wall thickness as consistent as possible. Sudden changes can create sink marks, warping, or internal stress. Ribs and bosses should usually be thinner than the main wall, often around 40–60% of its thickness. This reduces visible depressions on the outside surface. Small details matter here. A 3 mm wall connected to a heavy 6 mm boss can create trouble.
Draft helps the molded part leave the tool without scratches or distortion. A common starting point is 1° of draft per side. Textured surfaces may need more, while smooth surfaces may sometimes use less. That assumption needs checking. Deep cavities, tight tolerances, and polished surfaces can change the requirement. During review, inspect the pull direction, parting line, and ejector locations together. A design that looks correct on screen may still stick during production. Test samples, measured wall sections, and cooling observations usually reveal those hidden weaknesses.
Injection Molding Design: Gates and Runners for 70–140 MPa
Injection molding design turns a digital part into a repeatable physical process. At 70–140 MPa, gate and runner details strongly affect filling, packing, and surface quality. A runner that is too narrow increases shear and pressure loss. One that is too large wastes material and may extend cooling time. Mold trials often reveal this balance better than drawings alone.
Gate location should support even flow and reduce visible weld lines. For a broad panel, a fan gate can spread the melt across the cavity. For a smaller component, a pinpoint gate may control the entry area more precisely. The gate land must be short and cleanly machined. Pressure should reach the last-fill region before the melt freezes. This is where many designs need a second review.
Tips: Keep runner lengths similar when cavities share one manifold. Use flow simulation, then confirm results with short-shot studies. Check gate freeze time, part weight, and injection pressure during trials. A practical warning: the highest machine pressure is not automatically the best setting. Excessive pressure can flash the part, stress the mold, or hide an unbalanced runner system. Material viscosity, wall thickness, temperature, and venting also change the result. Small venting improvements sometimes outperform a larger pressure increase. That detail is easy to overlook.
| Design Area | Dimension or Parameter | Typical Value or Range | Design Function | Practical Consideration |
|---|---|---|---|---|
| Injection Pressure and Filling Conditions | ||||
| Injection pressure | Machine or hydraulic injection pressure | 70–140 MPa | Provides the force needed to fill the cavity and compensate for flow resistance and shrinkage. | Required pressure depends on resin viscosity, wall thickness, flow length, melt temperature, gate size, and part geometry. |
| Pressure utilization | Recommended process margin | Keep peak pressure below the available machine limit by approximately 10–20% | Leaves capacity for material variation, temperature changes, and normal process drift. | Actual limits should be confirmed through mold-flow analysis and machine trials. |
| Melt temperature | Material-specific processing range | Typically 180–320°C for common thermoplastics | Controls melt viscosity and filling performance. | The correct range is resin-specific; excessive temperature can increase degradation, while low temperature raises pressure demand. |
| Filling time | Time from gate opening to cavity fill | Approximately 0.5–5 seconds for many molded parts | Balances shear heating, weld-line formation, air evacuation, and pressure demand. | Thin-wall parts may require faster filling; thick sections may require slower filling to limit shear and jetting. |
| Cold Runner Design | ||||
| Main runner | Runner cross-section | Full-round preferred; trapezoidal alternative when machining access is limited | Reduces flow resistance and limits the amount of frozen material. | A full-round runner provides the lowest perimeter-to-area ratio and generally the lowest pressure loss. |
| Main runner | Typical diameter | 4–10 mm | Feeds the branch runners while maintaining a sufficiently open flow channel. | Use a larger diameter for long flow paths, high shot volumes, or high-viscosity materials; avoid unnecessary oversizing that increases scrap. |
| Branch runner | Typical diameter | 3–8 mm | Distributes melt from the main runner to individual gates. | Branch runners are commonly smaller than the main runner but must remain large enough to prevent premature freeze-off. |
| Runner length | Flow-path length | Minimize length; commonly designed below 150–300 mm where layout permits | Reduces pressure loss, residence time, and cold-runner material waste. | Balanced layouts and short direct paths generally improve filling consistency. |
| Runner balance | Path length and resistance between gates | Equalized within the mold layout where possible | Allows multiple cavities to fill at similar times and pressures. | For naturally unbalanced layouts, runner diameters or gate restrictions may be adjusted after flow analysis. |
| Runner transition | Change in cross-section | Gradual transition; avoid abrupt steps | Limits turbulence, air entrapment, and localized pressure loss. | Use smooth radii and properly blended intersections at runner branches. |
| Runner intersection | Branch angle | Approximately 90° or less with blended junctions | Directs melt toward the gate while reducing dead zones. | Rounded junctions are preferable to sharp internal corners. |
| Gate Design | ||||
| Edge gate | Gate thickness | Approximately 40–80% of the adjacent wall thickness | Controls the rate of cavity filling and provides a manageable gate vestige. | The gate should be thick enough to avoid premature freeze-off but small enough to permit clean trimming. |
| Edge gate | Gate width | Typically 1.0–6.0 mm | Provides a broad entrance for filling flat or moderately large sections. | Increase width for long flow lengths or high-viscosity materials; verify shear rate and gate vestige requirements. |
| Pin-point gate | Gate diameter | Approximately 0.8–2.5 mm | Creates a small gate vestige and supports automatic gate break-off in suitable molds. | Small diameters increase shear and pressure loss and may freeze early. |
| Submarine gate | Gate diameter | Approximately 0.8–2.5 mm | Allows automatic degating below the parting line. | Use a polished, sufficiently angled tunnel to reduce wear, sticking, and gate blockage. |
| Fan gate | Gate width | Typically 5–25 mm | Spreads melt across a wide front and reduces localized orientation. | Useful for broad surfaces, transparent parts, and materials sensitive to jetting or flow marks. |
| Tab gate | Tab thickness | Approximately 1.0–2.5 times the nominal wall thickness | Reduces jetting and moderates the initial melt velocity before the cavity is filled. | The tab is removed after molding and adds trimming work and material usage. |
| Direct sprue gate | Gate or sprue base diameter | Commonly 3–8 mm, depending on part size and wall thickness | Feeds the cavity directly from the sprue with a short flow path. | Suitable for large or deep parts when a visible gate mark and sprue vestige are acceptable. |
| Gate Location and Pressure Management | ||||
| Gate location | Distance from thick to thin sections | Gate toward thicker sections whenever practical | Promotes directional filling and helps pack thicker areas before gate freeze. | Gating thin sections first can cause hesitation, premature freeze-off, and higher injection pressure. |
| Gate location | Distance from visible or cosmetic surfaces | Place away from critical appearance areas when possible | Moves gate blush, weld lines, and vestiges away from high-visibility zones. | Final placement must also consider weld-line position, venting, ejection, and fiber orientation. |
| Gate land | Land length | Approximately 0.5–1.5 mm for many thermoplastic gates | Defines the controlled restriction between the runner and cavity. | Excessive land length increases pressure loss and shear heating; an overly short land can make gate control unstable. |
| Gate freeze-off | Hold-pressure duration | Continue until the gate has frozen; commonly 2–15 seconds | Determines whether additional packing pressure can enter the cavity. | Use a gate-seal study or part-weight test rather than relying on time alone. |
| Pressure loss | Runner and gate pressure drop | Minimize relative to the available 70–140 MPa injection range | Preserves pressure for cavity filling and packing. | Long runners, small gates, low melt temperature, and high-viscosity resins consume more available pressure. |
| Venting | Typical vent depth for many general-purpose thermoplastics | Approximately 0.02–0.05 mm | Allows displaced air and gas to escape without significant flash. | Vent dimensions are resin- and tool-specific; insufficient venting can mimic a pressure or gate-sizing problem. |
| Design Verification | ||||
| Flow analysis | Key outputs to review | Fill time, peak pressure, weld lines, air traps, clamp force, and volumetric shrinkage | Predicts whether the runner and gate system can fill the cavity within machine limits. | Use analysis results as a starting point and validate them with molded-part trials. |
| Clamping force | Approximate calculation | Projected area × average cavity pressure, with a safety margin | Prevents parting-line opening and flash during filling and packing. | Average cavity pressure is lower than machine injection pressure and must be estimated for the specific part and resin. |
| Process validation | Recommended checks | Short-shot study, gate-seal study, part-weight stability, dimensions, and visual defects | Confirms that the selected gate and runner design performs under real molding conditions. | Adjust melt temperature, injection speed, pressure, and hold time only after confirming the tooling design is suitable. |
Injection molding design begins with a clear view of how molten plastic will fill and leave the mold. One critical decision is sizing the clamping force. A common working range is 2–8 tons per square inch of projected area. Projected area means the cavity, part, and runner area seen from the mold-opening direction.
For example, a mold with 20 square inches of projected area may need 40–160 tons of clamp force. The correct value depends on resin type, wall thickness, flow length, injection pressure, and mold complexity. Engineers often begin with a middle estimate, then verify it through filling analysis and production trials. Too little force can create flash along the parting line. Too much force may increase stress, wear, and energy use. The range is practical, not absolute.
Injection molding design is a controlled balance between filling, packing, cooling, and ejection. For many molded parts, the complete cycle commonly ranges from 15 to 120 seconds. The Society of Plastics Engineers’ Injection Molding Handbook identifies cooling as the largest portion of this cycle, often consuming roughly 50–70% of total processing time. That figure makes cooling validation essential, not optional.
Cooling channels should follow the part’s thickest sections and maintain consistent spacing from the cavity surface. A practical trial uses thermocouples at the coolant inlet and outlet. For example, a 2°C outlet rise may indicate stable heat removal, while a sharp increase can suggest poor flow or blocked channels. Mold designers also check gate-freeze time, because early ejection can leave sink marks, warpage, or internal stress. It looks acceptable at first. It may fail later.
Cycle-time estimates should combine simulation with machine trials. Industry data from the U.S. Department of Energy shows that molding energy performance depends strongly on operating conditions, including cooling and machine utilization. A simulation may predict 28 seconds, but production testing could reach 36 seconds after temperature stabilization. That difference matters across thousands of shots. Engineers should record mold temperature, coolant flow, injection pressure, part weight, and ejection force during validation. One assumption often survives too long: faster cooling is not always better. Overly aggressive cooling can create uneven shrinkage and dimensional drift.